
(v2: edited 2/25/2025 to fix a data error for legendary monsters, read more here on that fix)
The 2024 Monster Manual is out, so we can finally answer all the questions we have: are 2024 Monster Manual monsters tougher than 2014 monsters? How much? How does WOTC design 2024-compatible monsters, and how can I do the same for my home games and publishing projects?
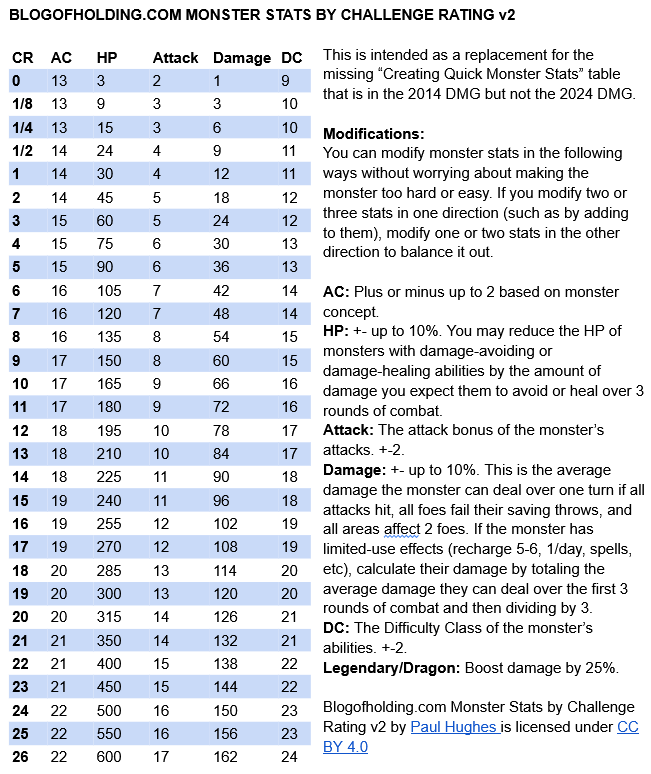
It’s up to us to answer these questions, because WOTC doesn’t do so. In the 2014 Dungeon Master’s Guide, WOTC offered charts that listed a monster’s base statistics by Challenge Rating. According to my analysis those DMG numbers didn’t perfectly match published monster statistics, but at least they offered a starting point. In the 2024 Dungeon Masters Guide, those guidelines are completely missing. There’s little monster-design guidance beyond “you can reskin an existing monster”, certainly nothing as concrete as a monster’s actual statistics by Challenge Rating. So in this post, I’ll reverse-engineer and share the 2024 monster design guidelines that should have been in the 2024 DMG.
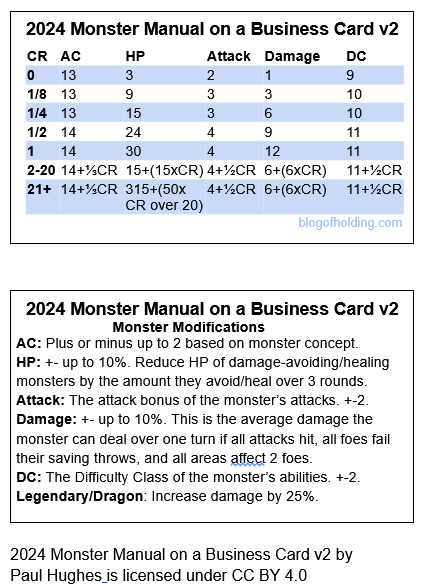
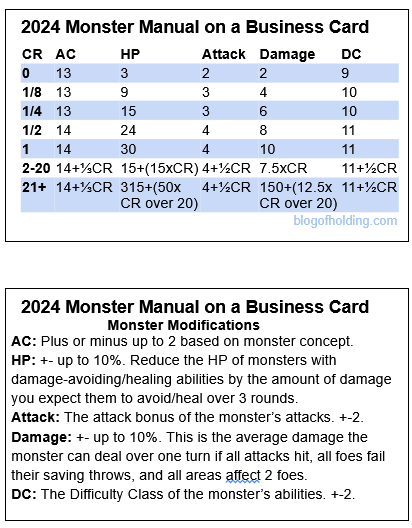
This is a long post, and if you don’t want to read the whole thing, here’s my conclusion ahead of time: the essential statistics you need to create a 2024-style monster, boiled down to business card size and released under CC BY 4.0. Lots more detailed charts and explanations below.
Or grab the google doc!
(This is version 2 of the card. For historical reasons, here’s version 1.)
(Fitting a Monster Manual on a business card is a tradition here at Blog of Holding: here’s one for fifth edition 2014 Monster Manual monsters, and here’s one I made halfway through fourth edition.)
To do this analysis, I plugged in each monster’s statistics from the 2024 Monster Manual into a spreadsheet. The most important statistics, in my opinion, are hit points and damage per round, but we should also consider AC, attack bonus, and effect DC, and we might as well also look at correlations between the various statistics.
Before we get into it I want to shout out Teos Abadia (Alphastream), who did a similar analysis, which was invaluable for me in checking my work. As usual, Teos’s conclusions from that video are spot on.
I also want to add a disclaimer: my analysis is just a cursory one, using a monster’s raw numbers. It doesn’t weigh in the balance a monster’s special exception-based features and condition-imposing effects – for instance, I don’t try to judge whether knocking someone prone is as valuable as gaining advantage. (Edit: But for more on that, here’s a post where I examine a few conditions, traits, saves, and so on!) I specially flagged a few monsters with major offensive or defensive features – the medusa, which can remove a character from play; the rug of smothering, which can share damage; and so on – and left these monsters out of my accounting. For the vast bulk of monsters, I just don’t account for these details. As Teos points out in his video, most monsters have a high-damage attack routine that imposes few conditions, and a lower-damage routine that imposes more conditions and other effects. Presumably the designers balanced these paths, and I’m using the high-damage path for my math. That said, not modeling the full monster’s abilities unavoidably adds some uncertainty into the following equations, but that’s something we’ll have to live with.
Ok, let’s get into it! We’ll check each of the monster statistics separately, then we’ll try to put them all together into coherent monster guidelines. Let’s tackle an easy and important one first: hit points per Challenge Rating.
hit points
Calculating hit points is easy: I simply plug in the HP of each monster in the book into Google Sheets and graph by challenge rating. Right now we’re concentrating on HP, and not considering other defensive statistics. How do 2024 hit points compare with 2014 hit points?
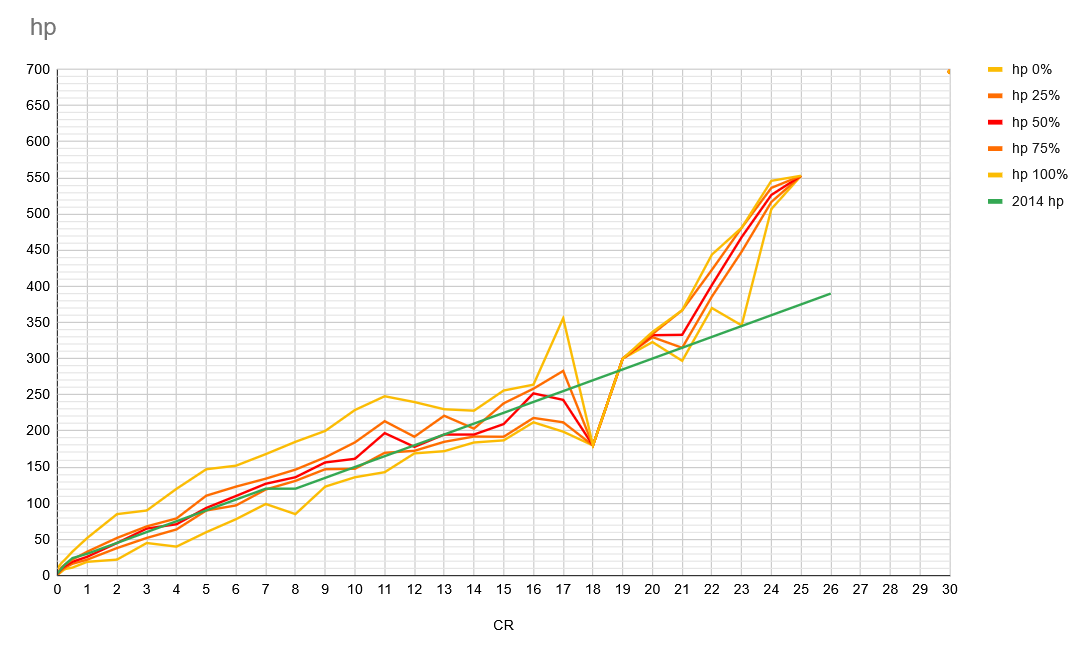
There are a lot of little squiggles on this chart, so let’s go over what it means. The most important line to look at is the red line, “hp 50%”. This is the median hit point value at a given Challenge Rating. The other orange and yellow lines allow you to visually get a sense of the “spread” of statistics at a particular Challenge Rating. The “hp 0%” line represents the lowest hit points of any monster at a given CR, the “hp 25%” humber represents the hp of the monster in the 25th percentile for hit points among all the monsters of that CR, “hp 75%” is the hp of the monster in the 75th percentile, and “hp 100%” is the hp of the monster with the most hp. This lets you see whether, for a given CR, most of the monsters had similar statistics, what the outliers looked like, etc.
As an example, let’s compare CR 17 and CR 18. Just from looking at the chart, you can see that CR 17 has a wide variance of numbers. The lowest hit point value for any CR 17 monster (the 0% line) is around 200. The highest value (100%) is 350! The median (the monster with the “middlest” hp) is just under 250 – 243, to be exact. Meanwhile, the 25% and 75% bands tell us what average monsters tend to look like. Half of all CR 17 monsters have hit point values between 212 and 283 hit points. When designing monsters, that range, between the orange lines, is what we should typically shoot for, with the outer areas of the chart being saved for exceptional monsters (oozes with high hit points, for instance).
Now let’s compare all that information to CR 18! As you can see, all five of those lines come together in one point, at 180 hit points. That’s because there’s only one CR 18 monster in the MM, the demilich, which has 180 hit points. That tells us that we can’t put a lot of faith in that number – it’s only a single data point. (And in fact, compared to monsters of neighboring CRs, the demilich appears to have exceptionally low hit points and high damage output for its challenge rating.) Distrust any data where all 5 lines come together into a singularity – it’s generally based on a single data point.
So that’s what the yellow, orange, and red lines mean. What about the green line? That’s the 2014 hit points formula for a given CR, based on my analysis of 2014 data. If that green line (2014 median) is close to the red line (2014 median) then that means monster design hasn’t changed too much. If those lines are far apart, that means our design rules need adjusting.
In this case of hit points, we can see that our 2014 formula is a pretty good match, staying mostly between the orange lines, up until about Challenge Rating 17, where the data starts to get a little noisier (as you’d expect, since each Challenge Rating tends to have a smaller sample size than the one before). Challenge 18 is where things take a nosedive, but I’m not too worried – that’s our friend the demilich. We can’t draw anything meaningful from that datapoint, nor from CR 19 which also has just a single datapoint, the balor. From CR 20 on, though, we can see that hit points pulls away from our 2014 model, rising much faster than it used to.
What shape is this data? Hit points doesn’t increase at a linear rate throughout, with each CR increasing by the same number of hit points (like +15 hit points every CR). It’s not a smooth curve either, which is what we’d expect from a geometric progression where each CR was multiplied by a fixed number (like each CR has 110% as many hit points as the last). In fact it looks like two linear increases – one from CR 1 through 20 or so, and a more extreme one from 21+ to 26 (with a lone datapoint out at CR 30, the tarrasque, not quite in line with that linear rate).
This graph is a little uglier than the 2014 one, but we judge monsters by playtests, not the elegance of their graphs. For now, let’s come up with an easy-to-remember, business-card-ready formula for calculating a best fit line for 2024 monster hit points. In creating this formula, since I want to be able to use it at the game table without a calculator, elegance does matter: I want to be faithful to the data while at the same time coming out with the simplest possible formula. Here’s my best approximation:
CR 0: 3
CR 1/8: 9
CR 1/4: 15
CR 1/2: 24
CR 1-20: 15 hp + 15 hp/CR
CR 21+: 315 hp + 50 hp/cr above 20
Here’s that graphed:
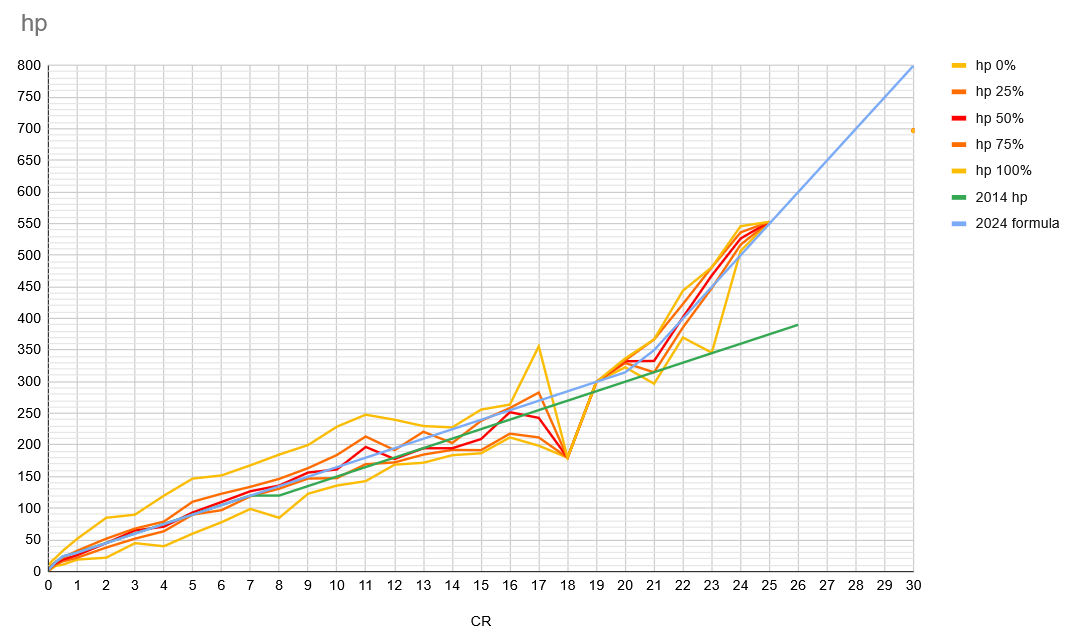
I think that’s a pretty good fit, considering the noisiness of the underlying data, especially at high levels! It overshoots the poor Tarrasque but what can you do. The Tarrasque probably has some HP deducted for its no-doubt ungodly regeneration. What exactly is its regeneration value anyway? It doesn’t have any at all? Huh!
damage per round
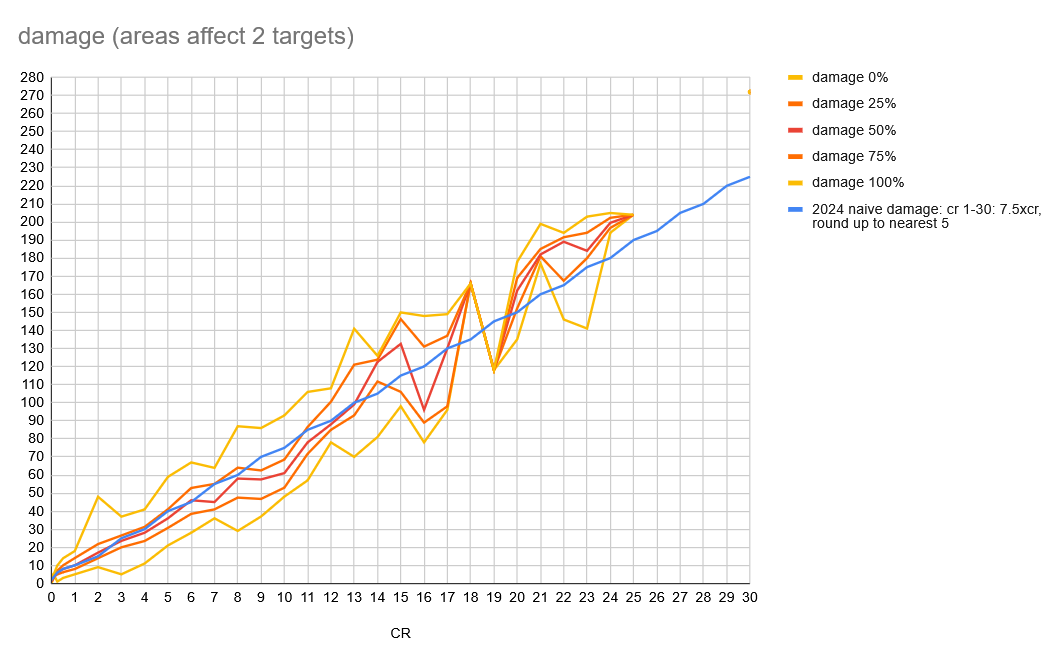
The damage per round calculation is an extremely involved one, with lots of room for different assumptions and tweaks. For the sake of comparing apples to apples (and because WOTC didn’t provide an updated calculation) I use the calculation WOTC included in the 2014 DMG for calculating a monster’s damage. It uses a number of assumptions: combats always last 3 rounds; monsters use their highest-damage options each round, not prioritizing non-damage effects; attacks always hit; foes always fail their save; area effects always deal damage to 2 foes; etc. To that I’ve added few judgment calls of my own: recharge 4-6 effects trigger twice; Save Ends and swallow effects trigger once; etc. It’s not a perfect representation of a monster’s DPR, since it doesn’t account for miss chance, AoE area, etc, but it does have the advantage of keeping things simple. We’ll use it.
Here’s a graph, similar to the hp graph, for damage. We’ve got the same probability bands (yellow 0% and 100% lines for outliers, orange 25% and 75% lines bounding the “most average” half of each CR group; the all-important red line for the median value; and the green line to show the 2014 damage expectation.
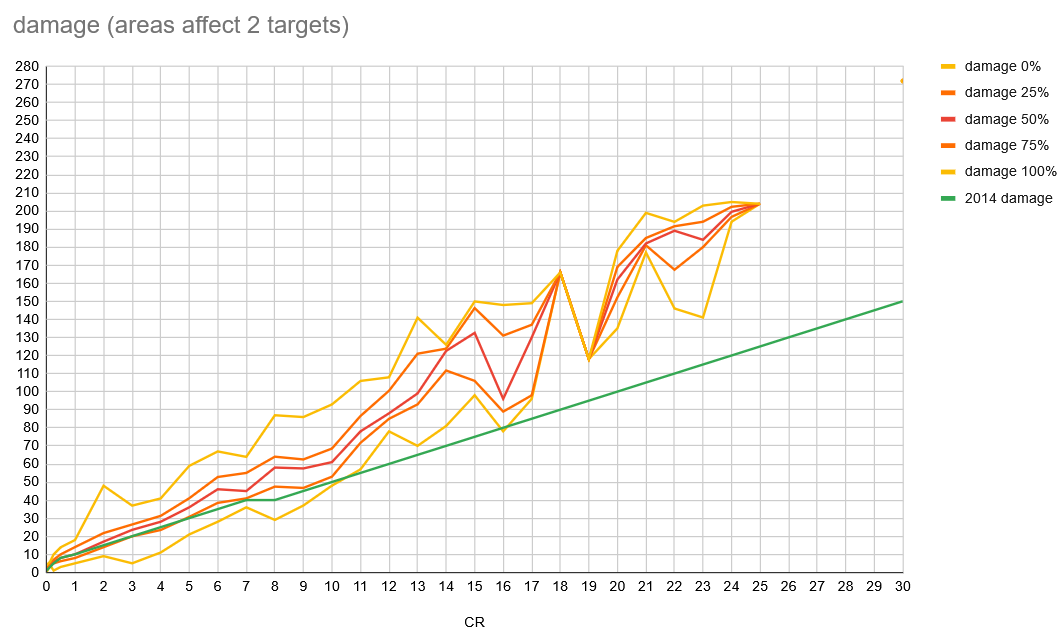
Wow! We can see that damage has gone up a lot since the 2014 edition, when a monster’s damage went up exactly 5 points every Challenge Rating. Now it looks like it’s about 50% higher. In fact, let’s try that – raising damage increase to 7.5 per Challenge Rating. (I’ll round it up to the nearest 5 hit points, because I don’t like fractional hit points and in order to nail the 10-point damage average from CR 1 monsters.)
Stop me if you’ve heard this one: this fit looks pretty good until around CR 20, when monster damage gets a turbo boost. This is exactly like what we saw with hit points. The damage graph needs to be not one but two linear progressions. Let’s try a gain of 7.5 per level up to level 20, and then a gain of 12.5 for CR 21+.
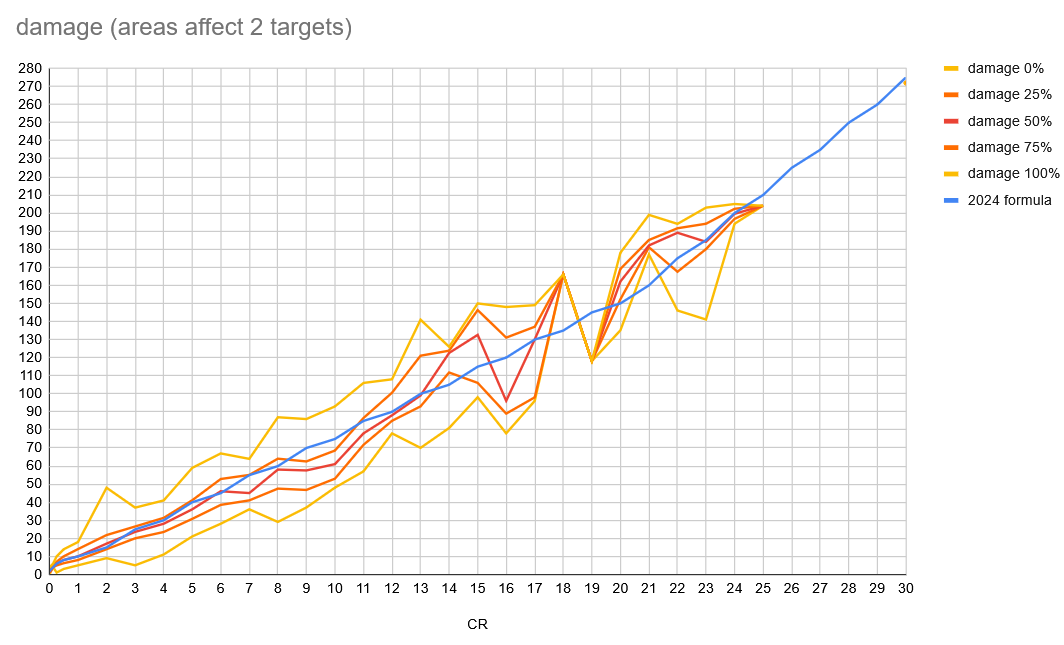
Now that looks like a good fit, and it happens to nail that CR 30 tarrasque damage output. Here’s our formula:
CR 0: 2
CR 1/8: 4
CR 1/4: 6
CR 1/2: 8
CR 1-20: 7.5 damage/CR (rounding up to nearest 5 damage)
CR 21+: 150 hp + 12.5 damage/cr above 20 (rounding up to nearest 5 damage)
(Edit: This isn’t the final formula I settled on in v2 of the card! Read on)
Attack Bonus
With the two heavy hitters – hit points and damage – out of the way, it’s time to nail down some of the other monster stats. Let’s tackle attack bonus first – that’s an easy one. I’m not bothering with all the different range bands here: attack bonus is very regimented.
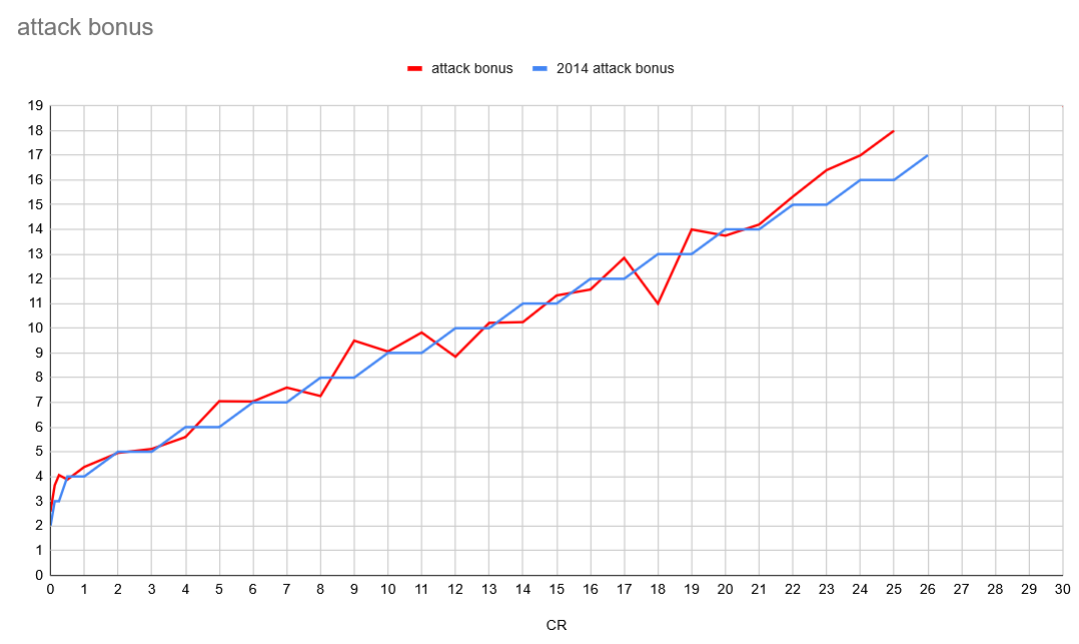
Attack bonus is virtually unchanged from 2014. The 2014 formula should work perfectly well.
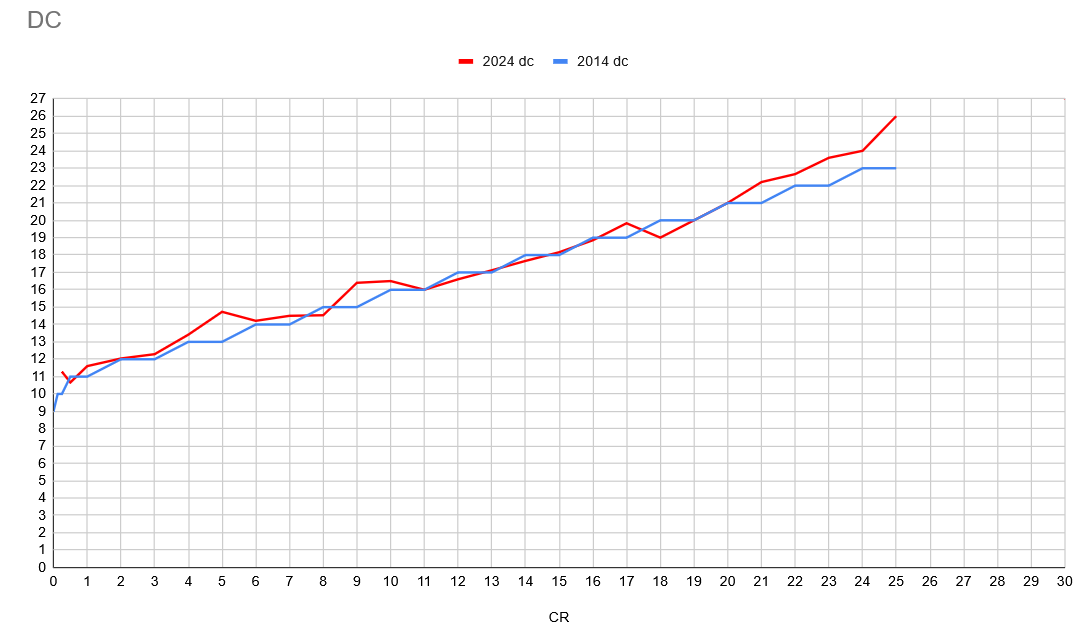
Armor Class
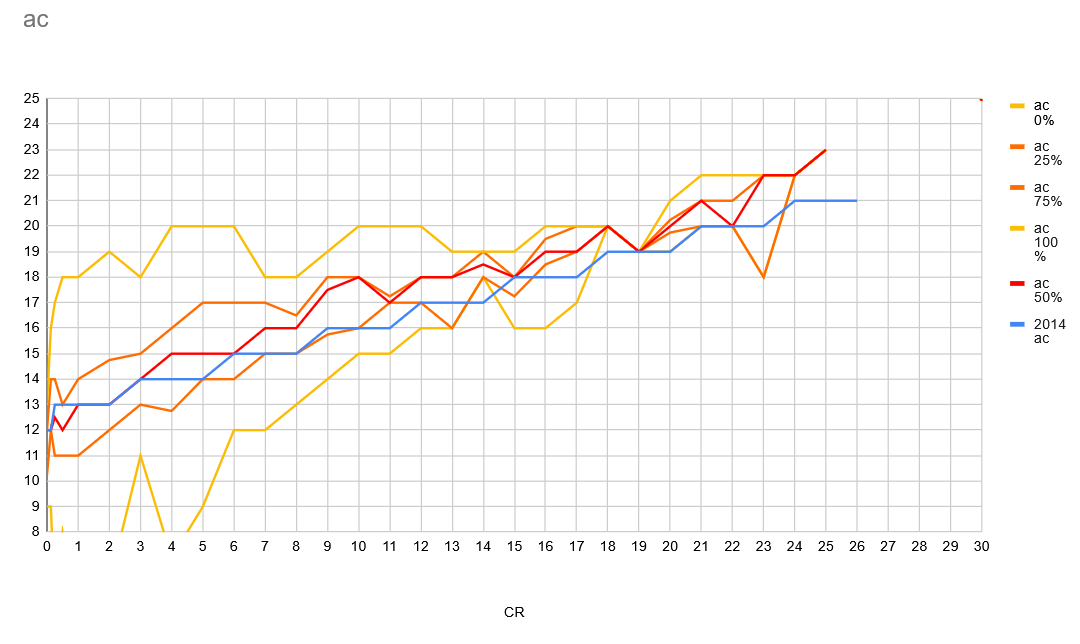
Here we have all the range bands calculated, showing a lot of variance for AC – it frequently has outliers that dip down low, especially at low CRs, for things like oozes and zombies. But the golden pathway – the area between the orange lines that accounts for 50% of monsters – is fairly tight.
On top of that I’ve graphed, in blue, my 2014 guidelines for AC. What do they look like to you? To me they look like they’re exactly 1 point low. In 2024, AC has increased across the board by exactly one point. The Tarrasque AC seems to suggest that AC accelerates more at high levels, but again that’s one data point.
DC
Here’s another quick one, graphing the best DC for each monster that has at least one spell or effect with a DC:
With the 2025 data and the 2014 guidelines on top of each other, we can see no difference. DC is unchanged.
Is there correlation between statistics?
According to 2014 monster creation guidelines, when you raise one statistic (or add a special feature or the ability to impose a condition), you lower another statistic accordingly. Therefore, even leaving aside special features and conditions, you’d expect an inverse correlation between a high stat in one area and high stats elsewhere. For example, if a monster has very high hit points, you’d expect something to be lower – damage, AC, etc – to compensate for it. However, my 2014 analysis came to a startling conclusion: there was no statistically significant correlation between high damage, AC, or hit points and low statistics elsewhere. In other words, among the monsters with high hit points, you couldn’t expect lower damage or other stats to compensate. This was an unexpected finding – and seems like a flaw in the 2014 monster manual, with especially high or low scores leading to unbalanced monsters!
Does the 2024 Monster Manual fix this problem? Can we expect better balance?
This time around, I did regression analysis as for the 2014 data but I also did a binomial distribution calculation, which is easier to demonstrate. They both came to the same conclusions. I want to talk through the binomial distribution, which is something that is easy to see in the data without complex tools.
Binomial distribution analysis is the kind of thing you’d use to determine whether your coin flips true (heads and tails the approximate same number of times). It’s used for situations where there are two outcomes you want to test, like heads and tails.
My question was: given all the monsters with low hit points (hit point totals less than average for their Challenge Rating), how often do they have corresponding higher than average damage, attack bonus, or AC? In other words, if a monster flips tails for their hit point value, how often do they flip heads for damage?
To answer that question, first I ranked every monster, giving it a value of 0 or 1 in damage, hp, ac, and attack bonus, with 0 being below average and 1 being above average.
For the analysis, I mostly concentrated on monsters with low hp. (I didn’t need to evaluate monsters with high hp – the values would be exactly inverse.) I compared hp vs damage, hp vs ac, and hp vs damage bonus. Besides hp comparisons, I also throw in a comparison of attack bonus and damage, which I thought would be interesting. For data-cleaning reasons, I ignored outliers/monsters who are the only one in their CR, and exactly-average monsters whose data I don’t care about one way or the other. Data is to the right.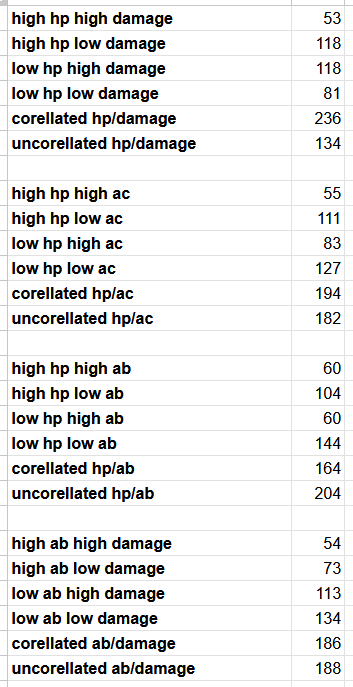
For each comparison, I counted the number of monsters who are a) above-average in each category, b) below-average in each category, and c) and d) above average in one category and below average in the other. The total of c) and d) I call “correlated monsters”, that is monsters that to me seem properly balanced. The total of a) and b) I call “uncorrelated monsters”, that is to say badly balanced monsters (or monsters whose raw stats don’t tell their whole story).
If a particular comparison shows a statistically significant preponderance of correlated monsters, then that’s good. If there is no statistically significant variation (or, worse, a statistically significant preponderance of uncorrelated monsters) that’s bad.
How does the 2024 Monster Manual measure up?
The highest correlation I measured was a good correlation between hit points and damage (the most important category). In other words, high-hit point monsters tend to deal less damage, and vice versa. The count was 236 good monsters vs 134 bad monsters. Great!
Correlation between hp/AC and attack bonus/damage were statistically insignificant.
There was a minor but statistically significant bad correlation between hit points and attack bonus – that is, creatures with above-average hp tended to have above-average ab, and vice versa – with 164 “good”, balanced monsters and 204 “bad”, unbalanced monsters. That’s not ideal, but personally I don’t think attack bonus is the most important stat compared to hp and damage so it could be worse.
After regression analysis and binomial distribution, I can say that I think 2024 is better balanced than 2014, but I have a feeling that it’s still not terribly well balanced. However, this kind of analysis hits a wall because we’d really need to be considering all of a monster’s non-numerical abilities to judge their balance. So we’ll just give a tentative thumbs up and move on.
What about different monster types?
the 2014 Monster Manual had a quirk: for their Challenge Rating, some creature types tended to have better statistics than others. In particular, dragons and beasts had much better raw stats than you’d expect. For instance, 2014’s CR 24 Ancient Red Dragon really hit like a CR 26 or so creature. This was true across the board.
I was curious how dragons and beasts (that is, creatures in the Animals appendix) balanced out this time. In addition, I expanded this analysis to include legendary (non-dragon) creatures and swarms. I graphed the two key categories, hit points and damage.
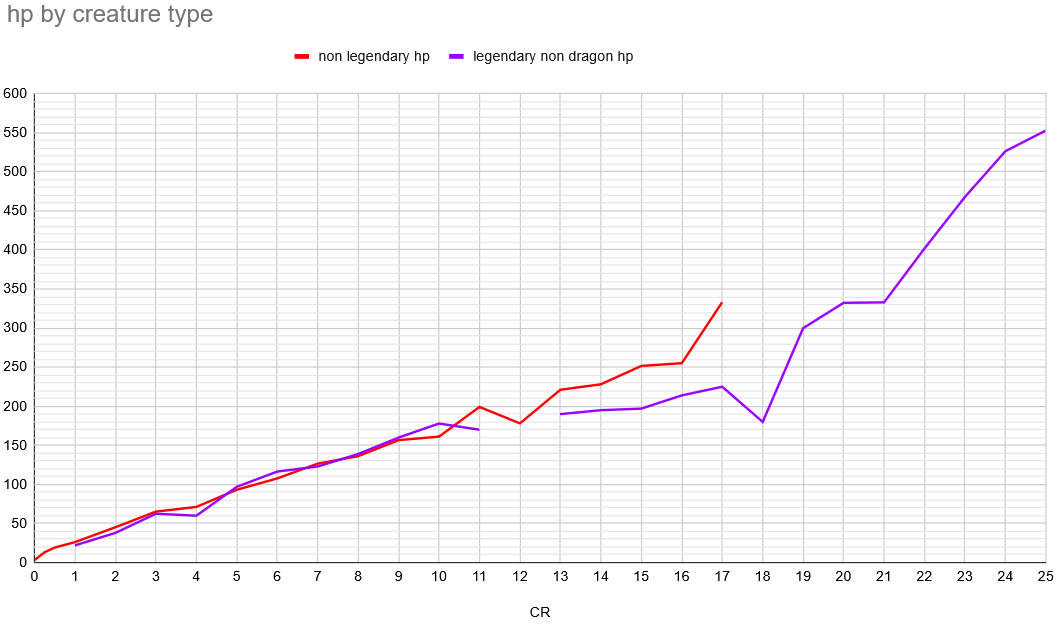
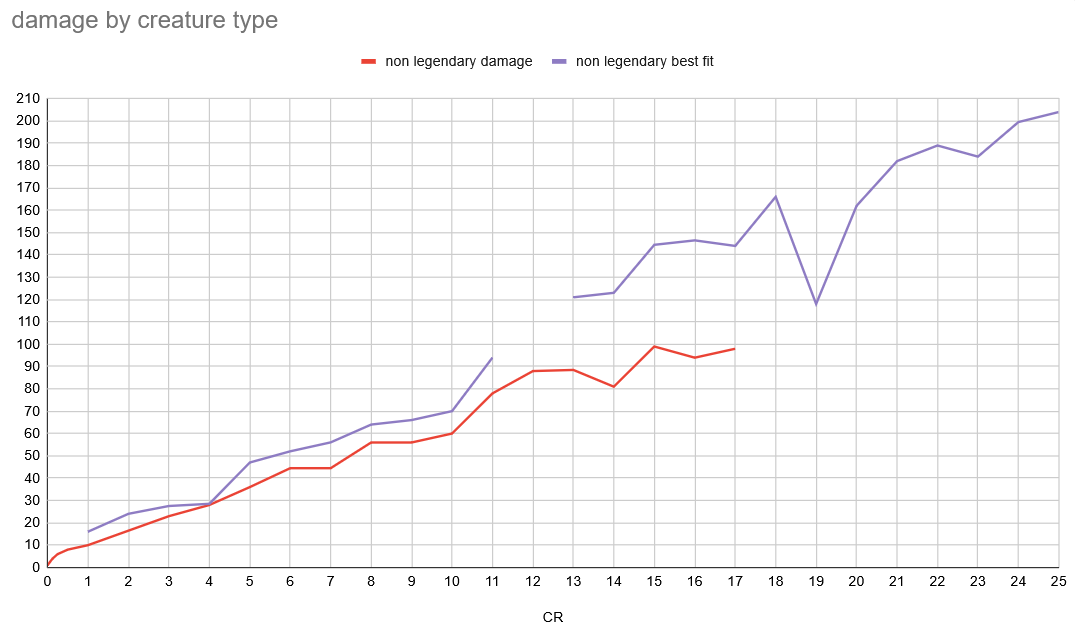
2/25/2025 edit: I found an error in the original HP by Creature Type and Damage By Creature Type graphs above, where the red line originally showed the average monster value for all monsters, instead of the average non-legendary monster value. My conclusion from this was that there wasn’t much difference between any of the lines. Of course there wasn’t, since I was comparing legendary+nonlegendary to legendary! I corrected the graph, and it does change the conclusions drawn from these slides. My original conclusion was “All the values are pretty close to each other”, but now it’s clear that, as in 2014, dragons do indeed run hot, and now other legendary creatures do too. This is especially clear from CR 13 to 17, but the difference isn’t as stark as it looks like. Here’s what I think is happening.
The dragons and legendary monsters from CR 0 to 12 have approximately standard hit points (sometimes running a bit low) and deal about 25% extra damage.
The dragons and legendary monsters from CR 13 to 17 have about 20% less hit points than non-draconic and legendary monsters, and they do about 45% extra damage.
Then above CR 17 it’s a mess, with just a handful of legendaries and no normal monsters providing insufficient data for strong conclusions.
To me, the above looks like a general rule that could be stated as dragons and legendary monsters deal an extra 25% more damage, with tweaks applied to some monsters, especially adult dragons, to lower their hp and raise their DPR, probably to make room for those massive breath weapons. I get into this more in this post.
end of edit
2024 Monster Guidelines
OK, now that we’ve run the numbers, we can come up with our official Blog of Holding 2024 monster guidelines, both the mini “business card” size at the top of this post and the maximal “one page” size, below.
Or grab the google doc!
(This is v2 of the guidelines, including the legendary monster adjustments discussed above!)
There’s a little monster-building advice on there, about how to vary monster statistics and so on. If you follow the advice, your monsters will for the most part fall within the “orange path” and will rarely be super-huge outliers. Remember, this is all reverse-engineered WOTC monster-building advice, not my own monster building advice (which I’ve given elsewhere, in sources like the Monstrous Menagerie!)
This is just the start of any analysis of the 2024 Monster Manual! There’s lots more to say, and more ways that we can slice up the data (now that the hard part, inputting the data, is done). Next, we’ll start figuring out the designers’ intent for the costs of various effects and attack riders (how much is advantage worth?) and figure out how monsters stack up against characters. Those will have to be other blog posts.


Truly doing the yeomen’s work, Paul! Good stuff!
Great stuff, thank you for putting in all this effort and sharing your insights!
Considering the big (and now presumably even bigger) part a large variety non-damage effects play in 5e, I imagine it‘s tricky to draw many conclusions. E.g., a spellcaster with a low AC and low hp may very be able to cast shield and misty step 3 times per day each… (a bit like the fallacy that spellcaster pcs are always squishier than martials)
I wonder if anything useful could be gleaned about monster roles? It seems to make sense high hp/ac monsters often also have high attack bonuses: they‘re typical melee-focused frontliners.
Have you taken a look at any change in number of attacks?
Hi! Thanks for the work!
In my 2014 table i also have monsters save, is there a reason in 2024 there isn’t this data?
Also, initiative changed a lot, can you include it? Thanks!
hi there, love this, new to the blog and from Scotland! this is amazing thank you! I’ve been trying to understand monsters for some time now and this is such a huge help. Can I ask a question? when calculating the average damage, id love to take this kind of approach myself to building monster – are there any weightings you put on attacks – so multiattack, vs aoE vs legendary, trying to figure out what assumption you make when calculating average dmg so that I can bring the same approach to calculating the damage for the monsters I create in my campaign.
Is monster HP above CR 20 315+50(CR-20) or 300+50(CR-20)? The business card uses the former, but the written-out table uses the latter.
Is there any chance you can do an analysis of monster saving throws by CR? They seem to be all over the place.
Thank you so much for this analysis! It’s way more helpful than literally the entire monster manual.